Reporting
Settings
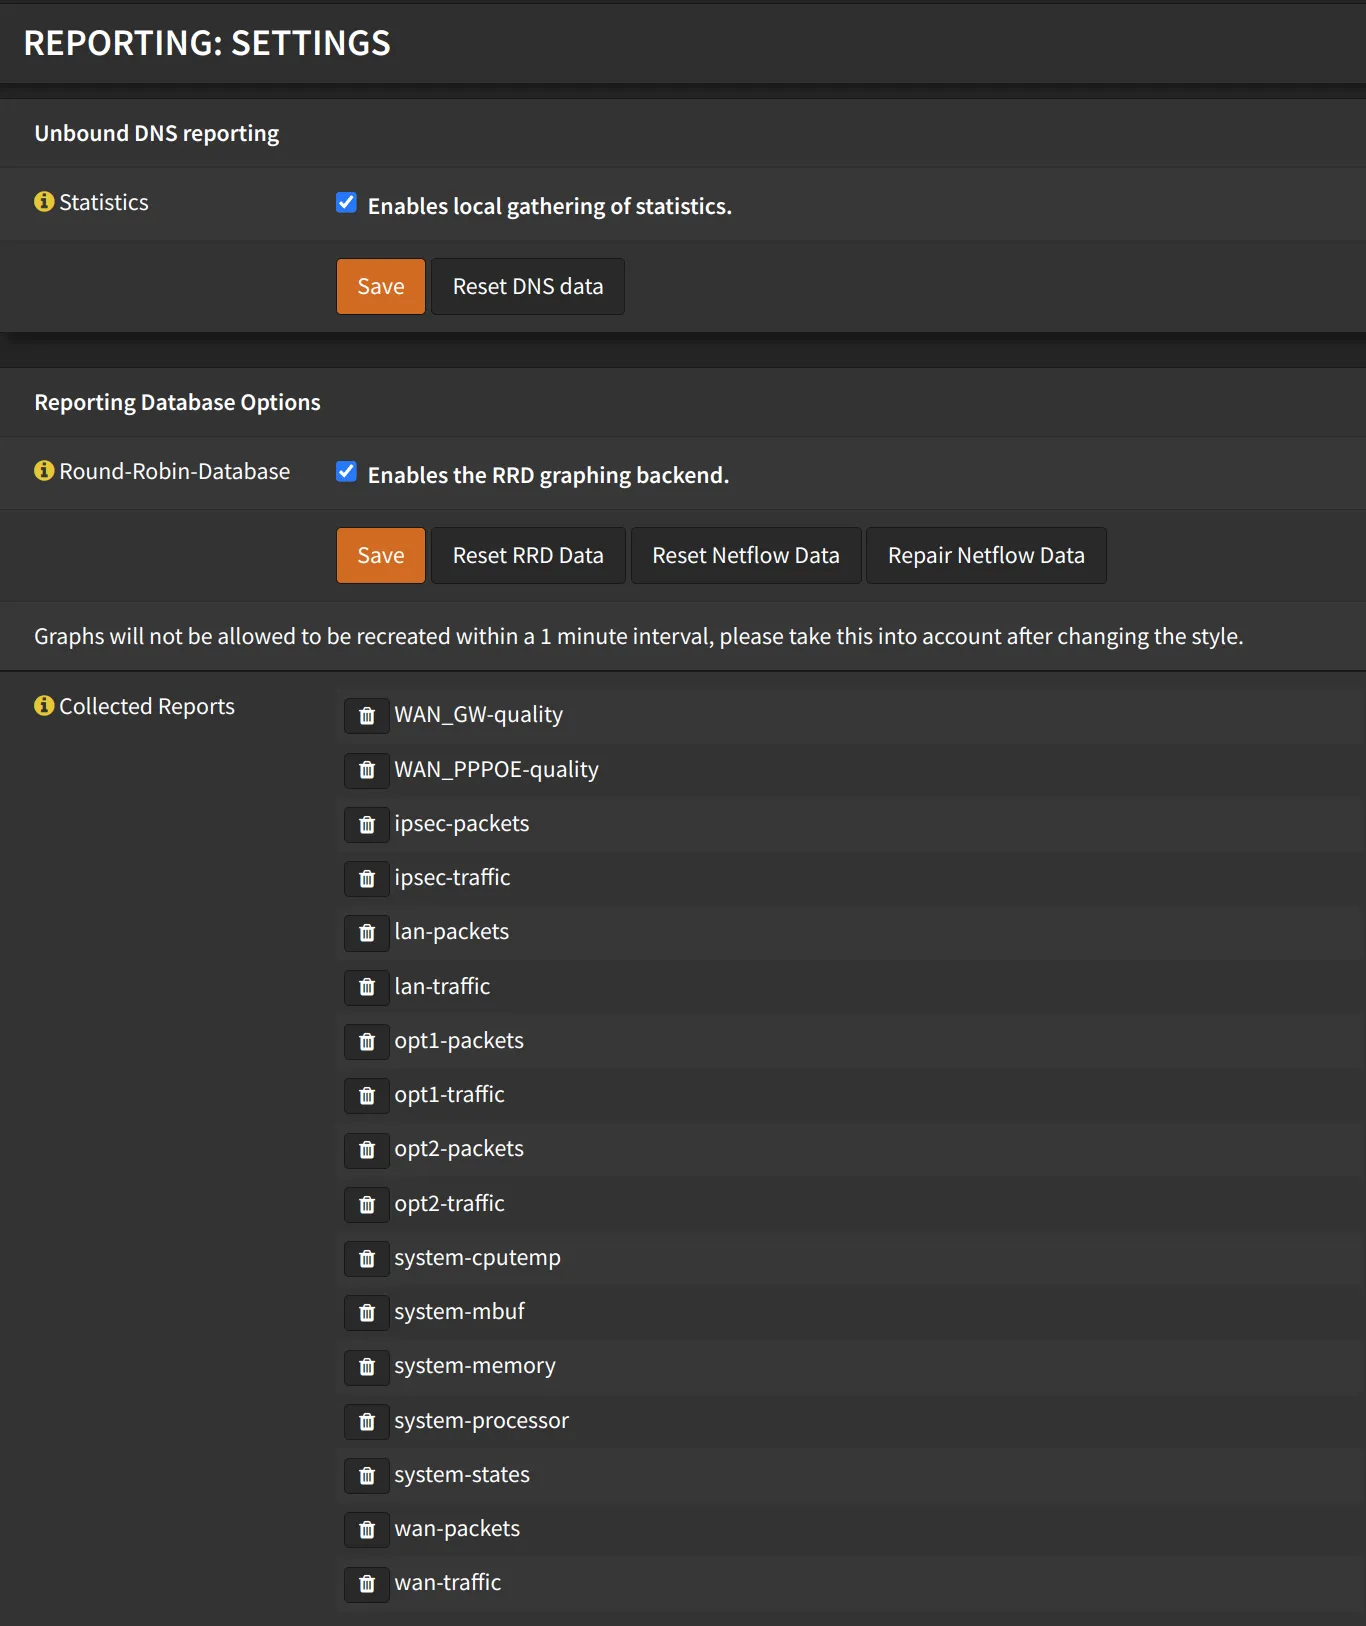
Section titled “Settings”Navigate to Reporting -> Settings
- Under
Unbound DNS reporting- Check
Enables local gathering of statistics - Click Save
- Check
- Under
Reporting Database Options- Check
Enables the RRD graphing backend - Click Save
- Check
NetFlow
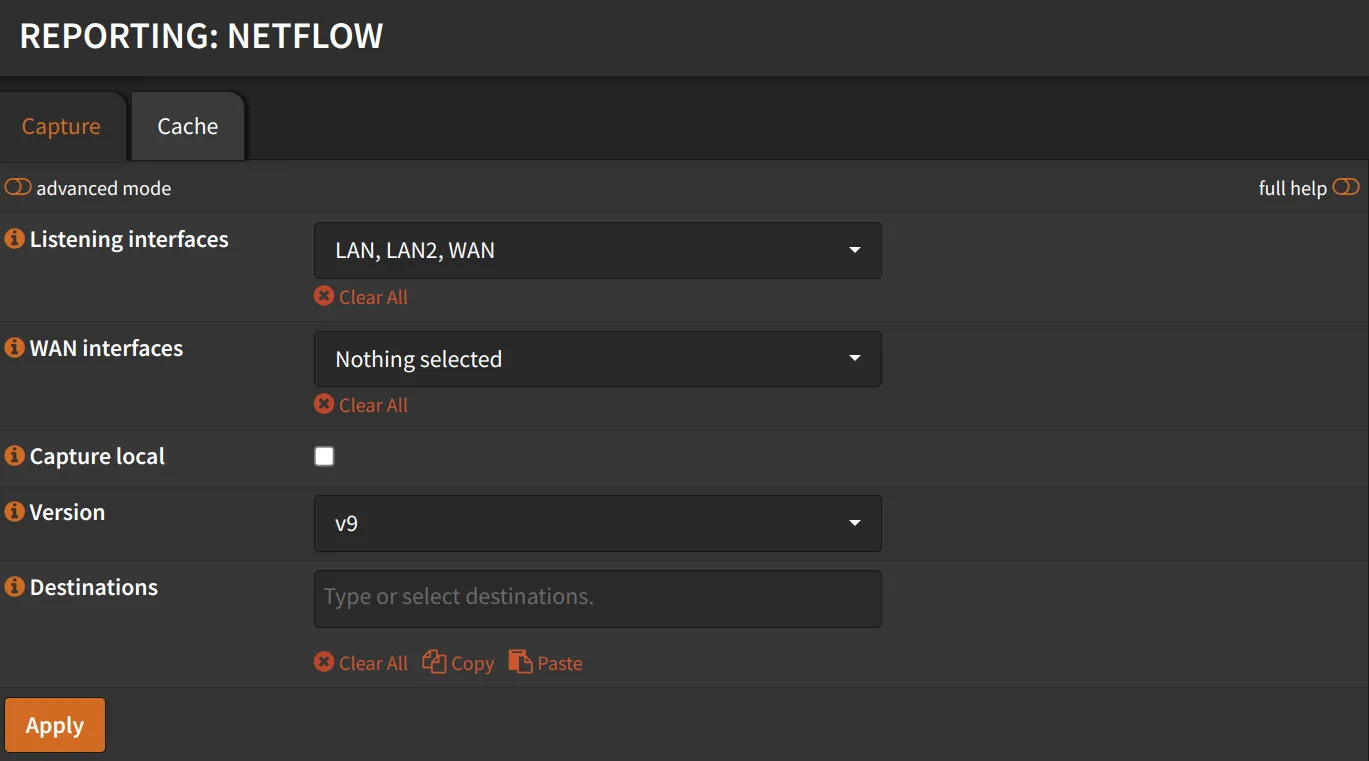
Section titled “NetFlow”Navigate to Reporting -> NetFlow
- Listening interfaces: Select all the interfaces you want to monitor
(Including
WAN) - WAN Interfaces: Select your
WANinterface - Check
Capture local
Click Apply
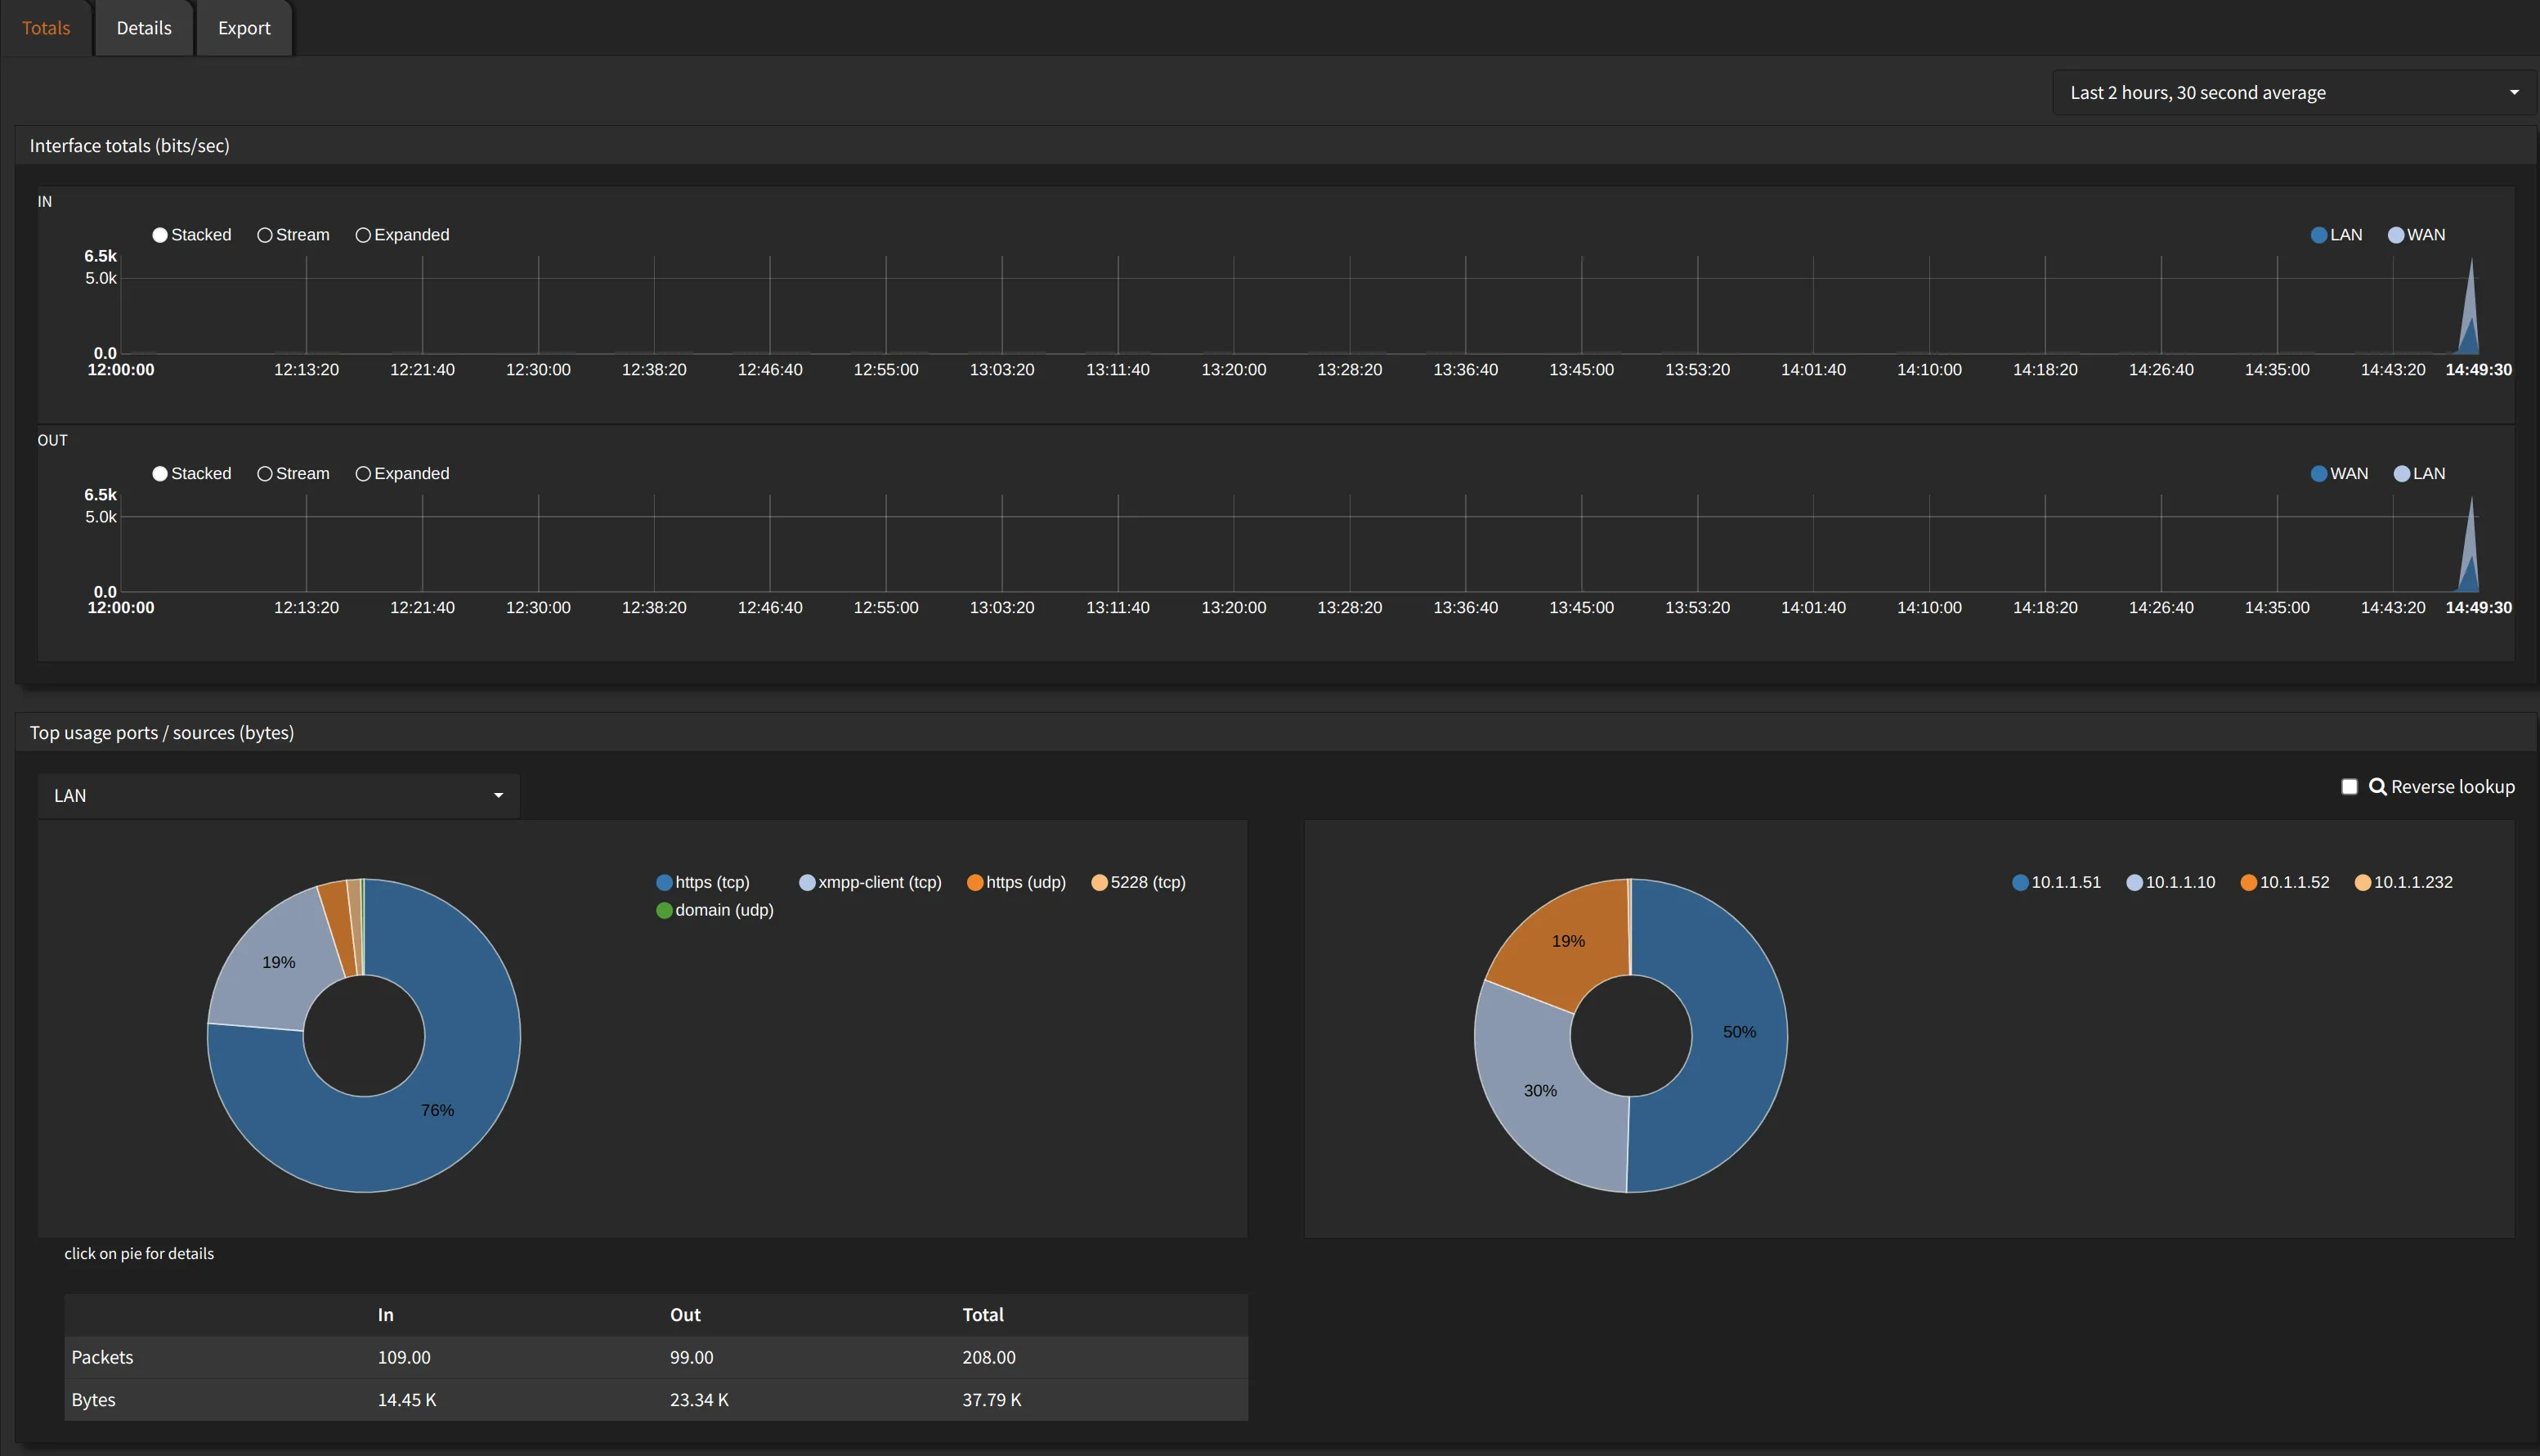
Now you can go to Reporting -> Insight and see the graphs.